ZTP Delta Strength (DS) is a 100% original ZTP idea. It was not created to repeat bar delta in a new color or to make a raw number look more important than it is. DS is designed to evaluate the strength behind delta — whether the pressure is expanding, weakening, being absorbed, or changing character before price makes that obvious.
That distinction matters because many order-flow displays simply show the delta of the bar inside a red or green circle and let the presentation imply that something special has been discovered.
True story – Another NinjaTrader order flow vendor threatened to sue me when I developed DS. I told them to stop putting the delta of the bar in a green/red circle, like it was special, and never heard from them again.
But a decorated delta number is still just the delta of the bar. ZTP wanted a separate analytical layer. The indicators below are meant to demonstrate what the completed DS stack would feel like in practice: not just what the concept is, but what the trader would actually see on the chart.
The Four-Indicator DS Stack
DS Flow Ribbon: live visualization of expansion, compression, and re-acceleration of internal pressure.
DS Leg Pressure: structural measurement that resets pressure at each confirmed price leg.
DS Session Pressure: continuous session-reset cumulative DS truth series.
DS Price-Pressure Oscillator: relative lens for confirmation, distribution-like behavior, accumulation-like behavior, and divergence.
DS Flow Ribbon
July 21, 2026 · 9:30-11:30 ET
What the completed indicator is showing
The completed ribbon translates cumulative DS into a live, multi-speed pressure display.
In the opening weakness, fast pressure begins improving before price fully turns.
As the upside move strengthens, the ribbon widens, showing expansion rather than a simple color flip.
During the mid-chart pullback, the ribbon compresses, warning that internal pressure has cooled.
Late in the window, the ribbon re-expands as buyers regain control.
Why it matters
The Flow Ribbon is the live-state member of the stack. It is designed to make acceleration, compression, failure, and re-acceleration readable in seconds. The point is not to create another moving-average crossover. The point is to let the trader see whether pressure is broadening, narrowing, or rotating before a structure change becomes obvious from price alone.
DS Leg Pressure
July 23, 2026 · 10:25-12:25 ET
What the completed indicator is showing
DS resets at each confirmed price leg so the trader can judge the quality of the leg itself.
Early selloff legs stack negative pressure normally.
A later lower low forms with less negative leg pressure than the prior leg, a meaningful weakening clue.
The climactic low still shows a final burst of selling pressure and exhaustion, so the indicator must distinguish weakening from a true washout.
Reversal legs then build positive DS as buyers take control.
Why it matters
Session totals can hide what is happening inside the active leg. Leg Pressure solves that problem by starting a new pressure chapter whenever structure confirms a new swing. It is a structural companion, showing whether the next lower low is as forceful as the prior one or whether the move is degrading internally.
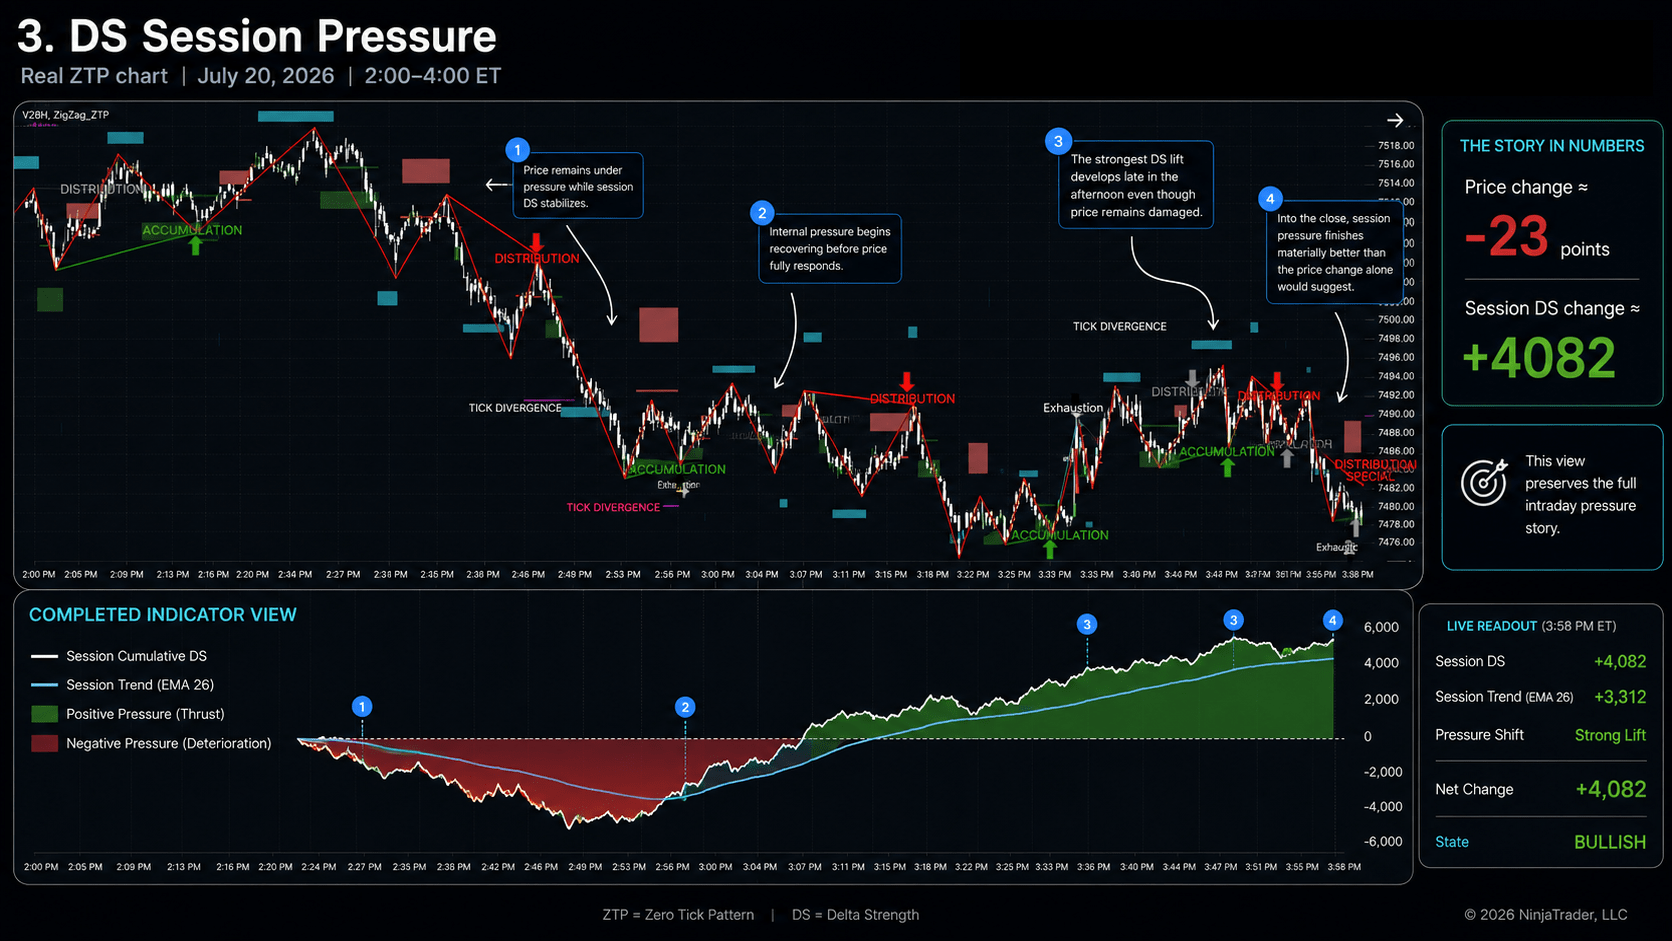
DS Session Pressure
July 20, 2026 · 2:00-4:00 ET
What the completed indicator is showing
This is the session truth series: one cumulative, session-reset pressure story.
Price finishes the window down roughly 23 points, but Session DS improves by roughly 4,082.
The completed indicator view shows where pressure stops confirming the damage and begins lifting materially before price repairs itself.
Late in the afternoon, the strongest DS lift develops even though price still looks damaged.
By the close, the session-pressure readout is materially better than the price change alone would suggest.
Important note: Beginning at 1550 each day the Market on Close orders begin to execute and option dealers will also be closing positions and buying/selling any ES futures used as a hedge, resulting in a lower price on this chart. The liquidity, or lack of it, will matter to all DS indicators.
Why it matters
The other DS views become more useful when they can be checked against a continuous session narrative. Session Pressure is the audit trail beneath the stack. It preserves the full intraday path and identifies the internal pressure inflection without pretending that a better pressure profile automatically means an immediate reversal.
DS Price-Pressure Oscillator
July 24, 2026 · 1:00-3:00 ET
What the completed indicator is showing
The oscillator measures the relationship between price and DS, not price alone and not DS alone.
Into the early high, relative quality weakens even as price pushes higher.
The first major drop is genuine bearish confirmation as price and pressure align lower.
A later bounce cannot convert improving flow into durable price recovery, creating a failed-stabilization warning.
The deepest selloff develops into a climactic bullish divergence: price makes a lower low while pressure improves.
Why it matters
This is the relative-agreement lens of the stack. It helps the trader separate confirmation, accumulation-like behavior, distribution-like behavior, and late-stage exhaustion. Just as important, it teaches restraint: a positive oscillator does not automatically mean buy, and a negative oscillator does not automatically mean sell. The absolute DS context still matters.
How the Four Indicators Work Together
The four indicators are not competing answers. They are a coordinated evidence chain. Session Pressure preserves the full cumulative story. Flow Ribbon interprets the live pressure state. Leg Pressure measures the quality of each confirmed price leg. The Price-Pressure Oscillator reveals whether DS is confirming price, outperforming it, or underperforming it. Together they are meant to deepen the trader’s existing ZTP framework of accumulation, distribution, divergence, exhaustion, trend, reversal, and opportunity zones.
The Tick Rolling Context Filter
The Tick Rolling Context Filter, or TRCF for short, is the new Tick Confirm tool. It is showing you the state of $TICK and grading and displaying relevant thrust markers on the chart. A thrust marker is a small red or green is what you think, the gold box is a sustained thrust, and the black is counter trend indications. It gives a numerical grade, and its very interesting on when it is at extremes. At extremes you need to be aware of reversals as illustrated here.
Accumulation and Distribution Indicator
Building off the ideas behind the divergence indicator, is this new indicator. The shading is looking at whether the market is under accumulation or distribution. This is from the close today, July 27.
The other cool thing it does is to look at the cumulative delta when you have a pattern or divergence and tell you if the delta is working in your favor. It is looking at the cumulative delta trend. There is also a STR marking which is strength after the apex has been put in. You can see both of those working on the long accumulation divergence in the middle of the chart.
But what if you don’t have CVD confirmation going for you? Remember the KP2 Ratio and why it was important? If we have a high KP2 Ratio, that means there was significant buying/selling that was being absorbed by limit orders. If that’s the case, in most cases it would be spiking the cumulative delta and creating a trend in the opposite direction. So you may not get a confirmation on this indicator in a true accumulation or distribution.
WHEN ???
I know this is the question everyone is asking. There are also several new indicators along with these I am introducing. Additionally the divergence indicators and Delta Strength itself, were all made to work with BloodHound. The work that has not been done, is testing everything in BloodHound to make sure the output is available to BloodHound. It took almost 3 weeks just to make the divergence indicator work in BloodHound and make the changes that 7 years of continued use I wanted. But that all has to be re-tested along with these new indicators.
These indicators are running live now and there is only 1 visual bug related to auto-scale that I am currently working. But when I had this idea, to take the Delta Strength tool to a new level, I put the visual bug on hold because this was way too cool not to work on.
What has to happen then is to compile and distribute. That is not as easy as it sounds.