ZONETRADERPRO
VIEW LICENSING
ZONETRADERPRO / PRICE & STRUCTURE

RECOGNIZE STRUCTURE
BEFORE THE SIGNAL.

Read the developing auction. Identify higher-probability price behavior.

ZoneTraderPro organizes recurring price patterns and market structure into one framework, so you can tell whether price is trending, reversing, exhausting, accumulating or distributing — and act with context instead of guessing.

STRUCTURE OVER
INDICATORS
TREND, REVERSAL
& EXHAUSTION
CONTEXT BEFORE
ENTRY
ZoneTraderPro Price & Structure NinjaTrader 8 chart
STRUCTURE CREATES OPPORTUNITY
WHAT PRICE & STRUCTURE MEANS

SEVEN CORE PATTERNS.
ONE STRUCTURAL READ.

Price & Structure is the pattern side of ZoneTraderPro. It identifies recurring market behavior and frames it with support, resistance and intermediate structure — so a chart is read as a developing auction rather than a series of isolated bars.

Identify recurring behavior
The same structural conditions repeat across sessions and instruments. Patterns name them so they can be recognized early.
Know which phase price is in
Trending, reversing, exhausting, accumulating or distributing — each phase calls for a different response.
Combine structure with context
Patterns are read alongside zones, market internals and order flow — not traded blindly on their own.
CORE PRICE & STRUCTURE PATTERNS

THE STANDARD SETUPS

Normal-risk patterns used for everyday structural analysis. These form the base group most traders work from.

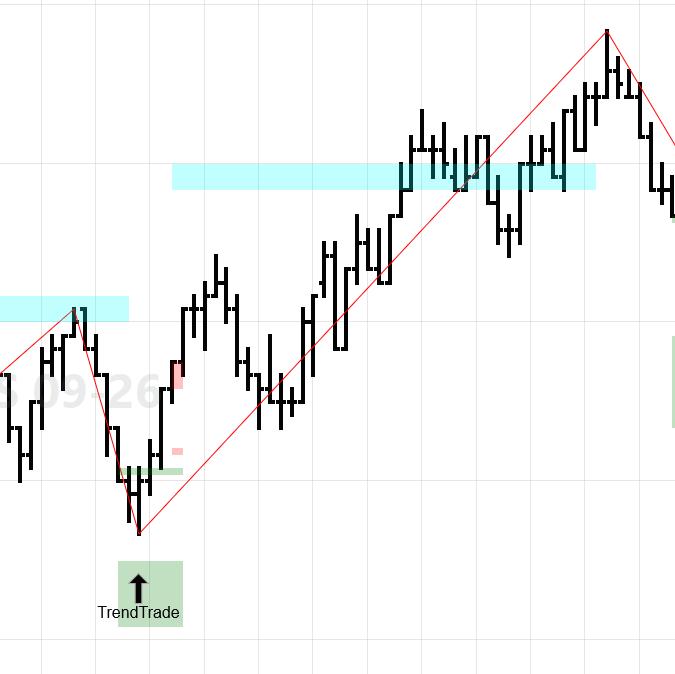
ZoneTraderPro Trend Patterns chart example

Trend Patterns

Continuation structure where directional control holds and price resumes with the prevailing move.

  • Organized, one-sided movement
  • Pullback and continuation behavior
  • Cleaner participation on the resume
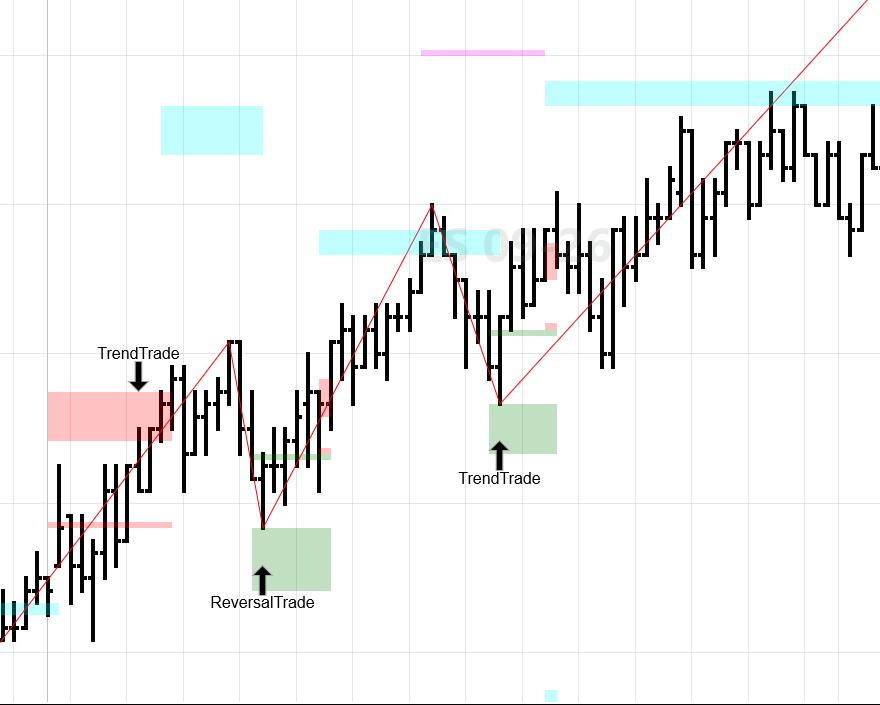
ZoneTraderPro Reversal Patterns chart example

Reversal Patterns

Transition structure. Prior control fails and price turns through the opposing intermediate zone.

  • Failure of the prior trend
  • Structure turns at the extreme
  • Change of direction with confirmation
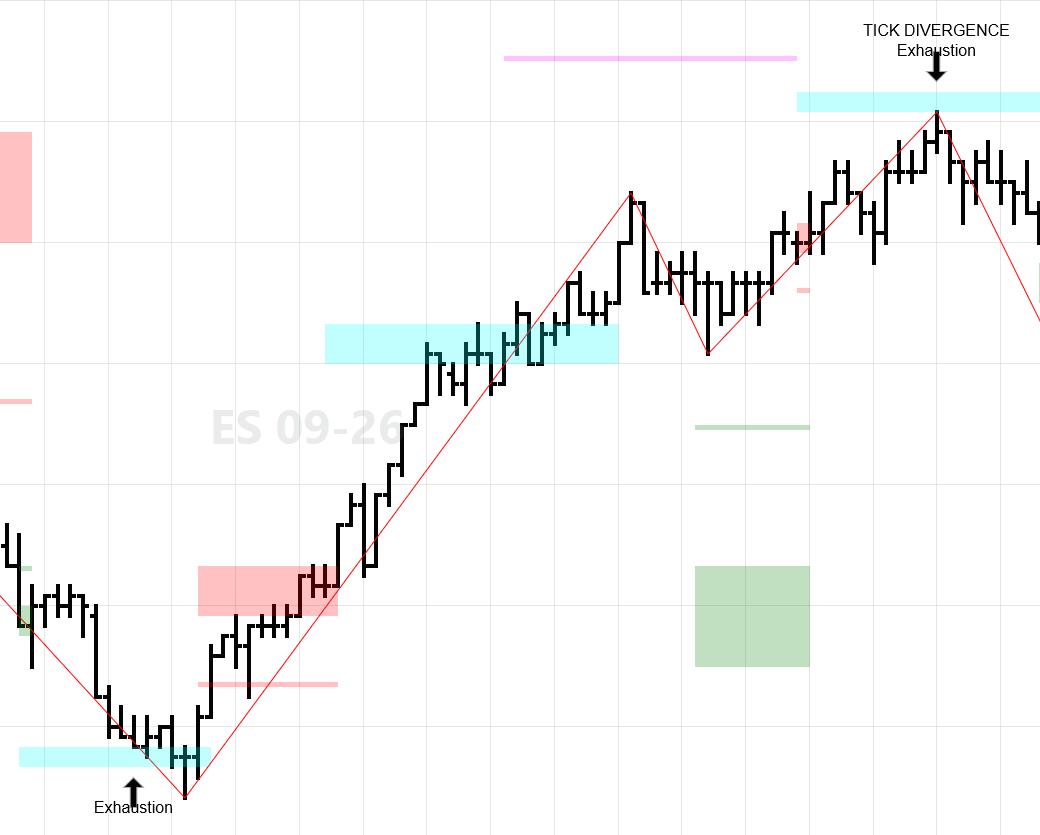
ZoneTraderPro Exhaustion Patterns chart example

Exhaustion Patterns

End-of-move behavior. Participation weakens and price loses the ability to continue.

  • Extended move, fading effort
  • Push without follow-through
  • Potential structural turn ahead
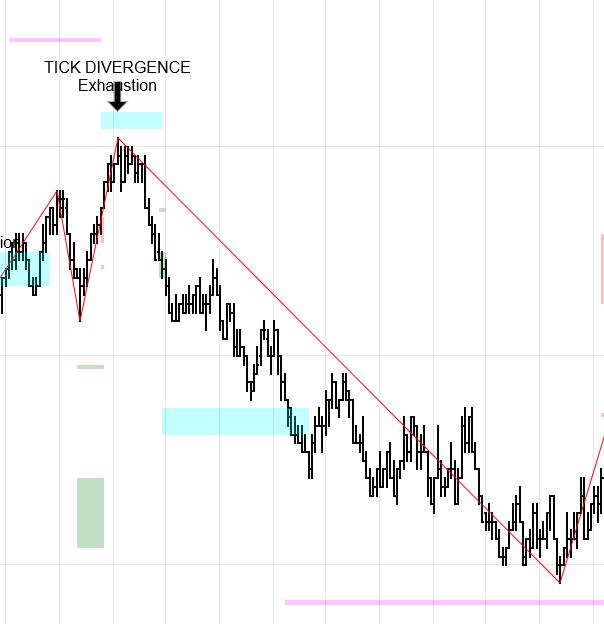
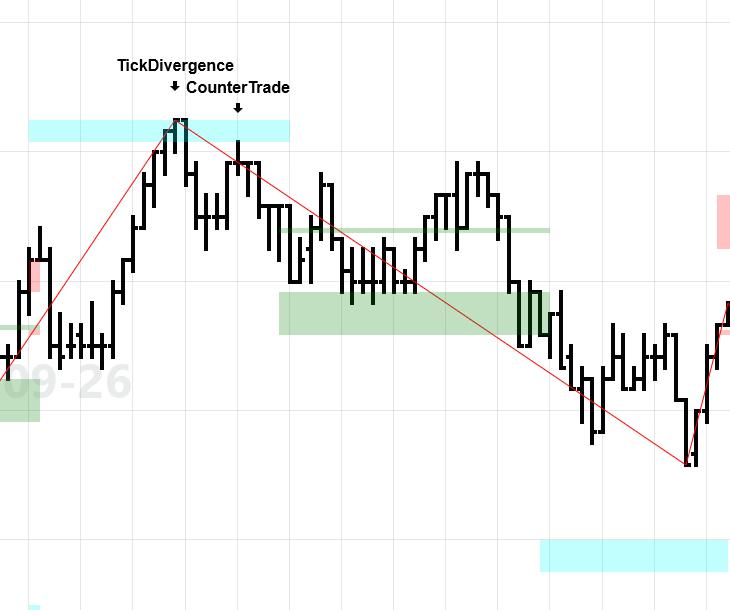
ZoneTraderPro TICK Divergence chart example

TICK Divergence

Price movement and internal pressure disagree — a new extreme that participation does not confirm.

  • New price extreme, weaker TICK
  • Participation fails to confirm
  • Early warning of a potential turn
ZoneTraderPro Counter Trend chart example

Counter Trend

Movement against the prevailing direction, traded with structure as the reference for where the push can carry.

  • Push against the prior direction
  • Structure frames the likely extent
  • Requires clear trade location
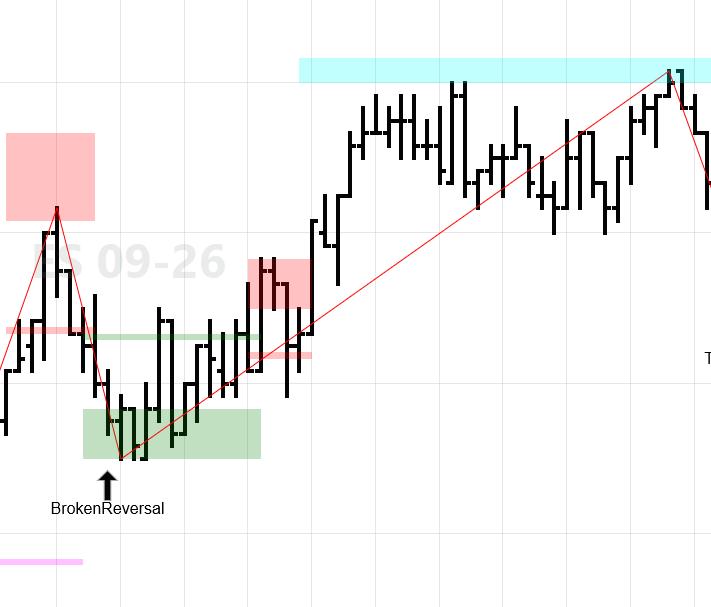
ZoneTraderPro Broken Reversal chart example

Broken Reversal

A reversal attempt fails and the prior trend resumes once the countertrend structure breaks down.

  • Failure of a reversal attempt
  • Trend resumes as structure breaks down
  • Identifies continuation after failed countertrend
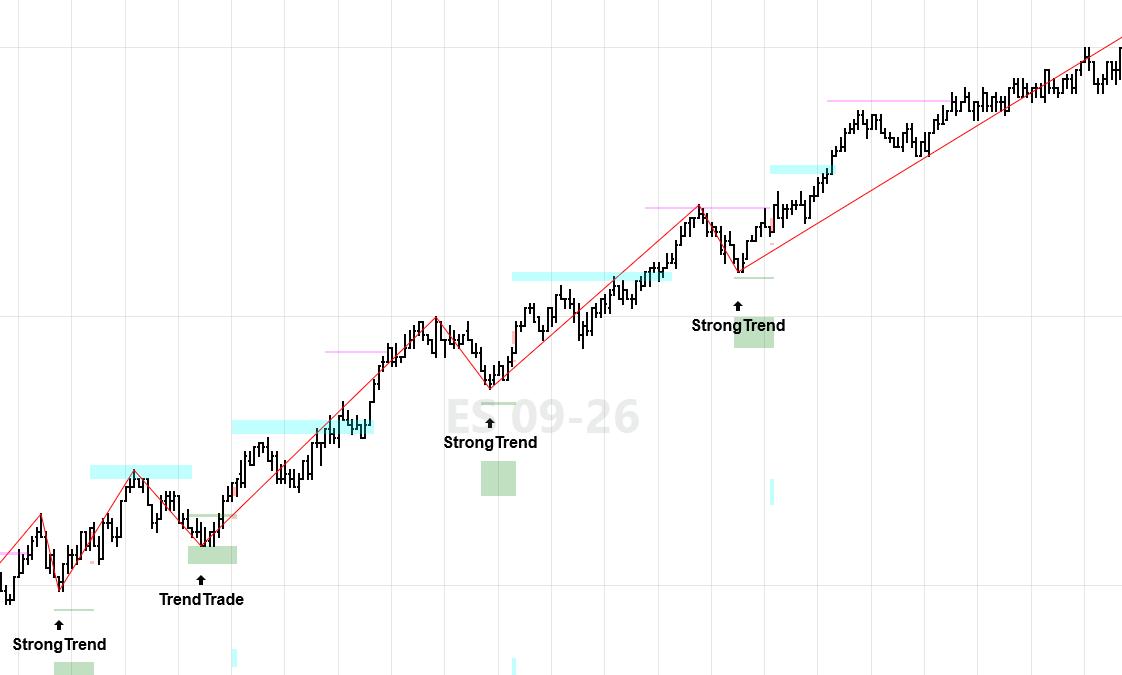
ZoneTraderPro Strong Trend chart example

Strong Trend

Persistent directional control, where pressure stays organized and the move sustains itself.

  • Persistent directional control
  • Organized, sustained pressure
  • Best when structure and context align
HOW TRADERS USE PRICE & STRUCTURE

BUILD THE STRUCTURAL READ

01
Identify continuation vs. failure
Determine whether the developing move is holding control or breaking down.
02
Spot possible turning points
Reversal and divergence structure flags where direction may change.
03
Recognize a weakening move
Exhaustion behavior shows when participation can no longer carry price.
04
Frame trade location
Use ZTP structure zones to define where a trade makes sense — and where it does not.
05
Confirm context before entry
Pair the pattern with market internals and order flow to confirm the read.
ADVANCED PATTERNS

OPTIONAL ADDITIONAL PATTERNS

Strong Trend and Strong Trend Reversal are optional additional pattern types — not part of the standard normal-risk group. They can involve greater risk and sometimes less favorable reward-to-risk characteristics, and they require more discretion and experience to use well.

ADVANCED USE ONLY
Not a recommended starting point. Best treated as additional context once the core patterns are established.
ZoneTraderPro Strong Trend and Strong Trend Reversal advanced chart example

Strong Trend and Strong Trend Reversals

Continuation and reversal attempts out of the strong-trend zone. They can carry more risk and less favorable reward, and demand experienced execution.

  • Reversal from the strong-trend zone
  • Less favorable reward-to-risk
  • Intended for advanced traders only
  • For use with the advanced ZTP Live Order Flow Analysis tools
  • Software redesign eliminates potential higher-risk trading situations illustrated here
ZONETRADERPRO

START WITH THE CORE. MASTER THE STRUCTURE.

See how Price & Structure fits into the full ZoneTraderPro framework — indicators, education and one-on-one training included with a lifetime license.