
Multiple TICK Divergence Calling Tops and Bottoms
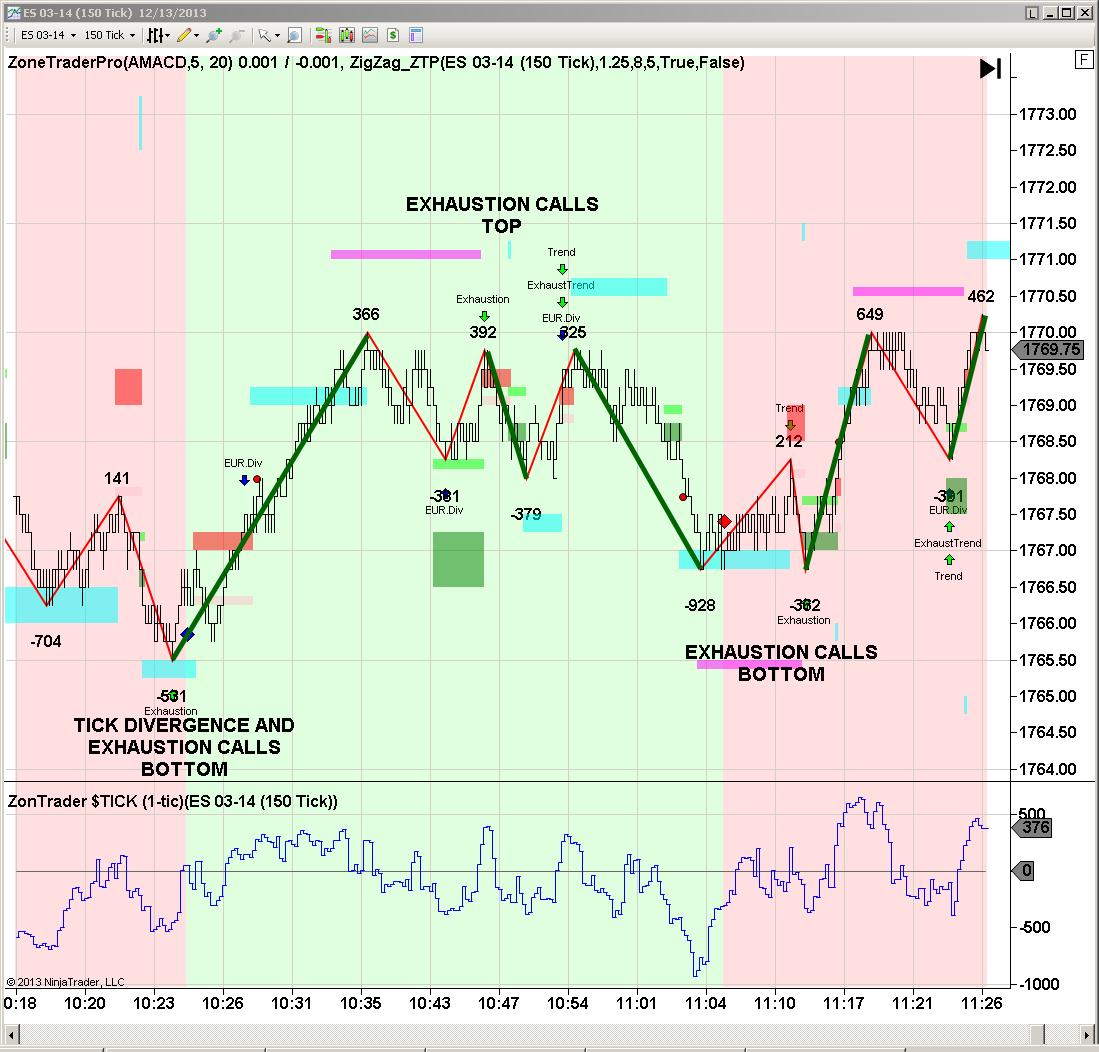
Friday’s trading saw some very profitable trades with tick divergence and the exhaustion pattern. At approximately 1025 a.m. the market bottomed and the ZoneTraderPro exhaustion trade was indicated which included tick divergence. The previous low tick was a -704 and as the market traded exactly at the blue counter trend zone the tick was only in -531. The resulting trade was worth 4.5 points.
Next we saw an exhaustion and exhaustion trend pattern immediately following that trade and again marking a short term market top.
But followed next was again another successful exhaustion trade followed by a successful exhaustion trend trade. You’ll notice that the exhaustion trend patterns also have a typical trend pattern indicated. There is nothing special about the fact that 2 arrows are indicating the trade. When there are 2 arrows it does not mean there is twice the likelihood of success. It only means the algorithm was satisfied for both patterns.
Later in the day at around 1230 p.m. we have an excellent example of a typical trend trade. Going into this trade we have a higher high tick and a higher low tick, which results in a successful 3.5 point trade. But what happens next is very interesting because we see low-volume on the way up and tick divergence exactly at the blue counter trend zone. As you can see from the following picture the market rose on very light volume at 1772 to 1773.50. This is a situation called no demand. When no demand occurs, what is happening is that sellers are lifting their limit orders and allowing the market to rise on very light volume, and are then becoming the smart money sellers. This is also the reason why you see the tick divergence, because nobody at the NYSE is buying the physical underlying stock either. There was a previous high tick of 827 however when the market traded 2 points higher the tick could only reach 552.

After the market trades at the blue counter trend zone the market fell 7.75 points. What was the reason for the nearly 8 point drop in the market? Look at the extremely congested area around 1771 which traded between 1215 p.m. and 130 p.m.

It was this large number of contracts that was suddenly unprofitable and saw their stops being hit which resulted in the nice selloff. It is also important to notice that the ZoneTraderPro tick filter told you around 140 p.m. at the market was going lower. The ZoneTraderPro tick filter is the solid red dot underneath the bar.