A recently discovered use of the ZTP Order Flow tool was to place the tool on a larger range chart and filter for only 3 signals. Those three signals were the ZTP Order Flow, POC Extension, and POC Absorption signals. We begin to see ZTP Order Flow at most market turning points. This is a proprietary signal that is an indication a large number of trapped traders from looking at the entire bar. This is why this signal is very important on a wide 12 range volumetric bar.
The KP2 ratio is the density of contracts per tick. A higher number, indicates accumulation and distribution. The problem is timing the entry. Look at the above example. The zigzag value is set to 5 points. The first dip of the ratio below the green trigger line is a perfect setup. The line for ratio is super important. The increasing value indicates that there is significantly increasing buyer support as price traded lower.
This is why using the micro ES contract has its benefits. You do not need to establish a full position with a single e-mini. That first entry is not your line in the sand to defend. With an e-mini as price trades lower, your stop is hit. With a few micro contracts, the loss is much less and you can use a bigger stop.
As price trades lower, to the blue counter trend support zone, additional mirco ES contracts can be added if, and this is very important, the ratio indicator is still supporting the trade. In this example it did. As price traded lower into the eventual low, the ratio value increased also. You would not want a decreasing ratio value on the lower low. The market traded over 14 points higher on this pattern. With the micro, you no longer have to hit the bullseye every time. You still need a stop and need to read the indicator properly.
There is one problem here. The ZTP Order Flow signal will print intra-bar. However the signal is not confirmed until the close of the bar. The ZTP Order Flow is a confirmation of a likely top or bottom being put in. The entry signal is watching the ratio indicator. A V shaped pattern indicates limit order support on the way down, and market orders coming in to turn the trend.
The ZTP Delta Strength indicator is also on the chart, and this is a textbook example of its use. The first colored circle is brown, denoting low volume. Price rising on low volume is not good for your long trade. However the second time down, the circle is now blue. Blue denotes high volume, between 140-175% of normal. A black color denotes even higher volume, greater than 175% of normal. The high volume denotes the buyers defending the price and turning the market.
When do we start looking for a Trade Setup?
As a general rule we would like to see at least 2 bars higher highs or lower lows as is illustrated in the chart above. The signal being given around 1530 hours was not as a result of a lower low. It may be a reason to exit a trade if still short, from the previous signal.
Why is the POC Absorption trade circled? Its not occurring at a higher high and there was no ZTP Order Flow at the high. This is true on the 12 range chart, however the POC Extension and Absorption are more powerful signals and an opportunity to add to an existing position or initiate a position.
On the 8 range chart we did get the signal on the test of the high and it was bracketed by very high volume.
Using the 8 Range Chart
The ratio on the trading chart (not shown) for this trade was 90, making it an excellent possible distribution trade. On this 8 range chart we received no less than 6 order flow sell signals.
On the 12 range chart we did not get any signals. It did tell us that there high volume and it did tell us we had a good reason for a trade. In a majority of these reversals, you see an extension zone being created one tick from the high.
This happens because limit order resistance is occurring as price rises. Price is rising until the market orders come in to actively and aggressively turn a market. This is a great signal to initiate a trade and it occurs very often with divergence trades.
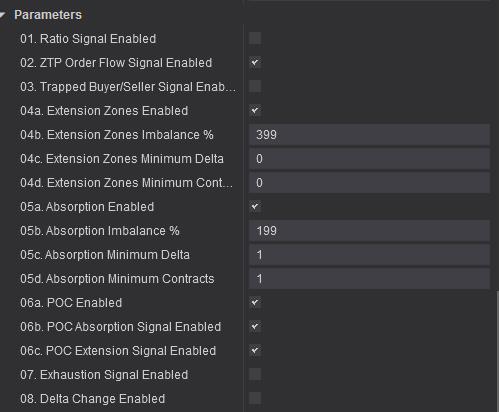
Indicator Setup on the 8 and 12 Range Chart
The settings for the audible arets give you a warning when the the bar is 8 ticks wide. It is important that to top value, Bar Tick Filter, is also set to 8.
These values are only suggestions, and you should test different settings.
So What Does Going Wrong Look Like
On the low at 0948 hours, we had an ZTP Order Flow buy signal as confirmation. It did not occur on the 12 range chart. Hence the reason to use both for confirmation.
Would you have taken a short trade where the delta strength seller came in at -31? There is a lot going wrong here. First we are in a strong trend price reversal pattern. In any strong trend, there is significantly increased risk and significantly reduced reward.
Putting that little detail aside, the ratio indicator is screaming not to short this. The ratio is falling as price is rising. This means sellers are stepping away with limit order resistance. Then the ratio indicator goes sideways as price is rising. This is also a bad sign for a short, and a good reason to stay long.
The 2 order flow charts are shown below. Neither chart gave a ZTP Order Flow sell signal, until price hit the top.
Only Order Flow Buy Signals in a 23 Point Move Higher
No Sell 12 Range
No Sell 8 Range
What is Common to See?
It is going to be common to see a test of the first ZTP Order Flow Signal as in this example. Again what is important is what the ratio indicator is telling us.
The ratio indicator was telling us the limit order resistance was increasing with price.
And we had distribution divergence as well. Great combination of signals.
Can the Order Flow be Traded by Itself? Without a Good Ratio?
This was actually a pretty difficult example to find. After a great POC Extension long trade entry for over 16 points, we get a series of two ZTP Order Flow short signals, followed by an even higher high with no signal. There never was a good ratio, in fact the indicator was going sideways and not responding with price.
The third ZTP Order Flow signal however occurred with an exhaustion price pattern as a test of the high and the ratio was falling with price. You can see the No Demand Special Divergence short signal. This was a great signal. Look at the order flow chart. An extension zone was created 1 tick from the high.
The overall majority of the signals however work with or without a good ratio.
So why will a Good Ratio Matter?
Here is a pair of trades. One long trade with standard divergence and a good ratio that gets 9 3/4 points. The short trade, with no ratio and a horrible KP2 ratio going sideways gets 5 3/4 points. You likely did not get paid on the second trade.
Your trader homework is this. What is my target if I trade with a ratio and without? Do trades with ratios get higher profits? Do trades with divergences get higher profits? What are the circumstances that you consider adding to a position? Where is your stop if you have received a confirmation signal with a good ratio?
The great thing about ZoneTraderPro is that you can go and backtest and easily find these answers, because nothing is going to change and repaint or redraw. Nothing is going to disappear.
Do Not Forget Your Other Charts
On the 3.5 point zigzag chart, order flow coincided with 4 of the 5 consecutive accumulation divergence trades.