The Exhaustion Day Trading Pattern
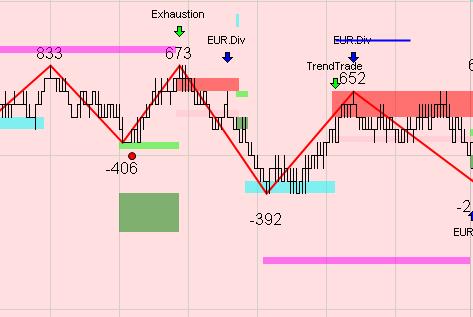
The exhaustion day trading pattern is a topping pattern. The exhaustion pattern occurs when the markets reverses from a minor support resistance zone. When price trades to the previous high/low the exhaustion arrow will signal a trade. In the example below, you see an exhaustion trade which is a test of a high, followed by a trend trade. This test of a high has a higher risk.

The reason that there is higher risk is that the market can trade to the blue countertrend zone as shown below. This is an example of an exhaustion trade with a better risk reward ratio, with the risk being 5-6 ticks.
The risk on the 1st trade was much higher at around 9-10 ticks. This is the only ZoneTraderPro pattern where the trading signal will move. About 30% of the exhaustion day trading patterns are a test of a high. The remaining 70% trade higher to run any stops that were placed just above the previous high.
What are some of the reasons that you would want to consider making the first trade with higher risk? There are several reason why this trade works, and they all have to do with the ZoneTraderPro filters.

In looking at the above trade, notice that the background on the chart is red. The red background signifies that the Euro futures are trading bearishly. The next filter is the tick filter. Notice the red dot at the -406. The red dot signifies that the $TICK is at least 100 greater than the previous low $TICK. The $TICK at the test of the high is 673 which is a lower $TICK high than the previous 833. So going into the trade there are more sellers and less buyers on the $TICK. Lastly the Euro divergence indicator is marking on the chart.

